How 2000 Buses Cover 500,000 km a Day in Sri Lanka
Despite the size, Sri Lanka provides an extensive network of inter-provincial bus routes. These routes cover almost 500,000 km among 2043 buses with 56 days of travel time in a single day. These buses provide an essential means of transportation for most Sri Lankans.
This analysis attempts to visualise the data at a very high level. This dataset represents "Normal bus" operations as reported by the National Transportation Commission in 2017 and excludes "Luxury" and "Semi-Luxury" bus operations. “Normal bus” operations fall under the cheapest mode of transportation with a lot more accessible stops along the routes. Normal buses can be identified by their red and yellow name boards.
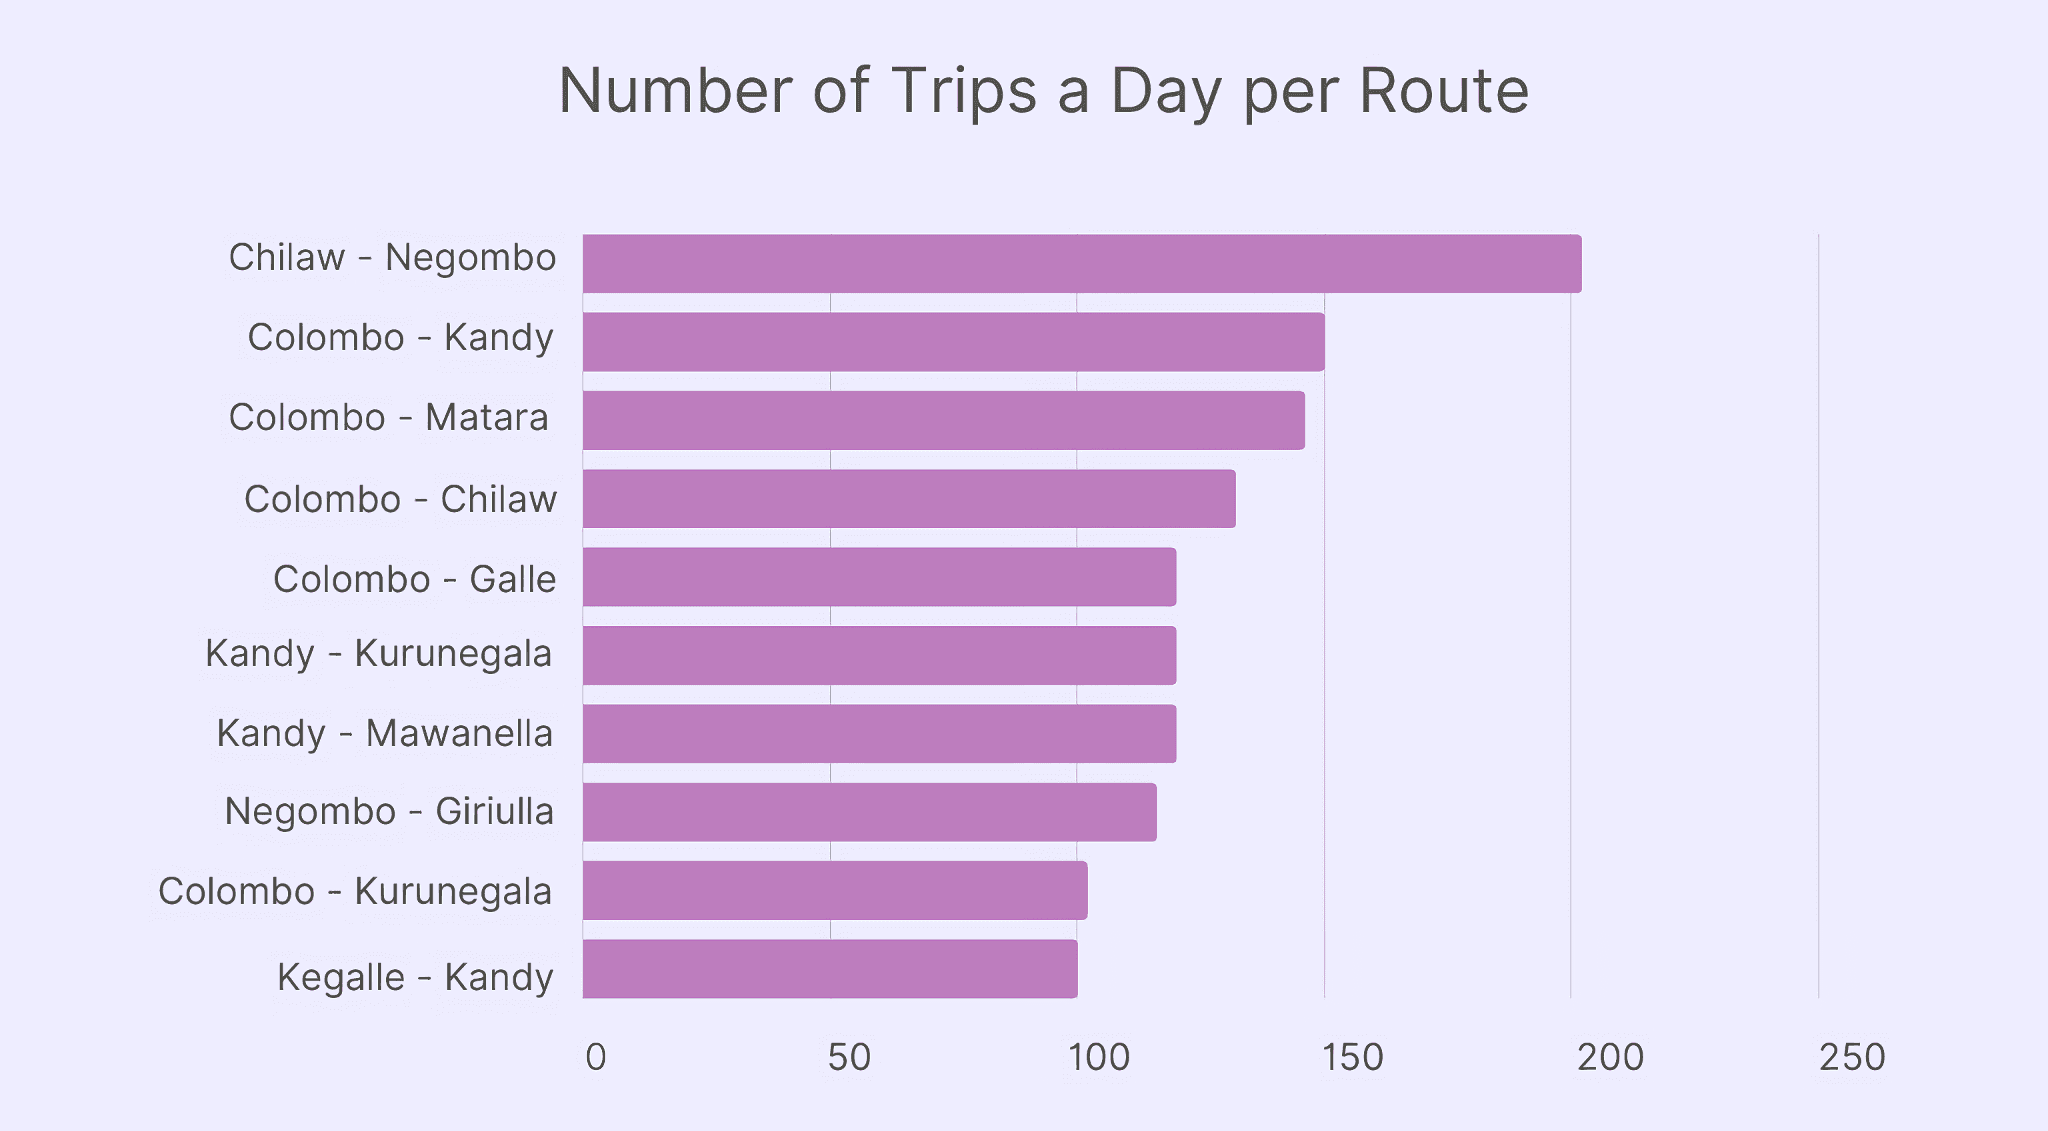
10 Most Frequent Trips
Most number of trips run between two western province districts, Chilaw and Negombo with a little over 200 trips a day. Colombo, being the financial capital with a higher population density serves as the starting point for most journeys.
It’s worth noting that most frequent trips condense in western and southern areas of the island. This can be partially attributed to better road infrastructure such as expressways. However, since 2017 there have been expansion projects to make these expressways more accessible to central and south-eastern provinces.
Use the mapping tool below to analyse route-by-route details for these most frequent trips.
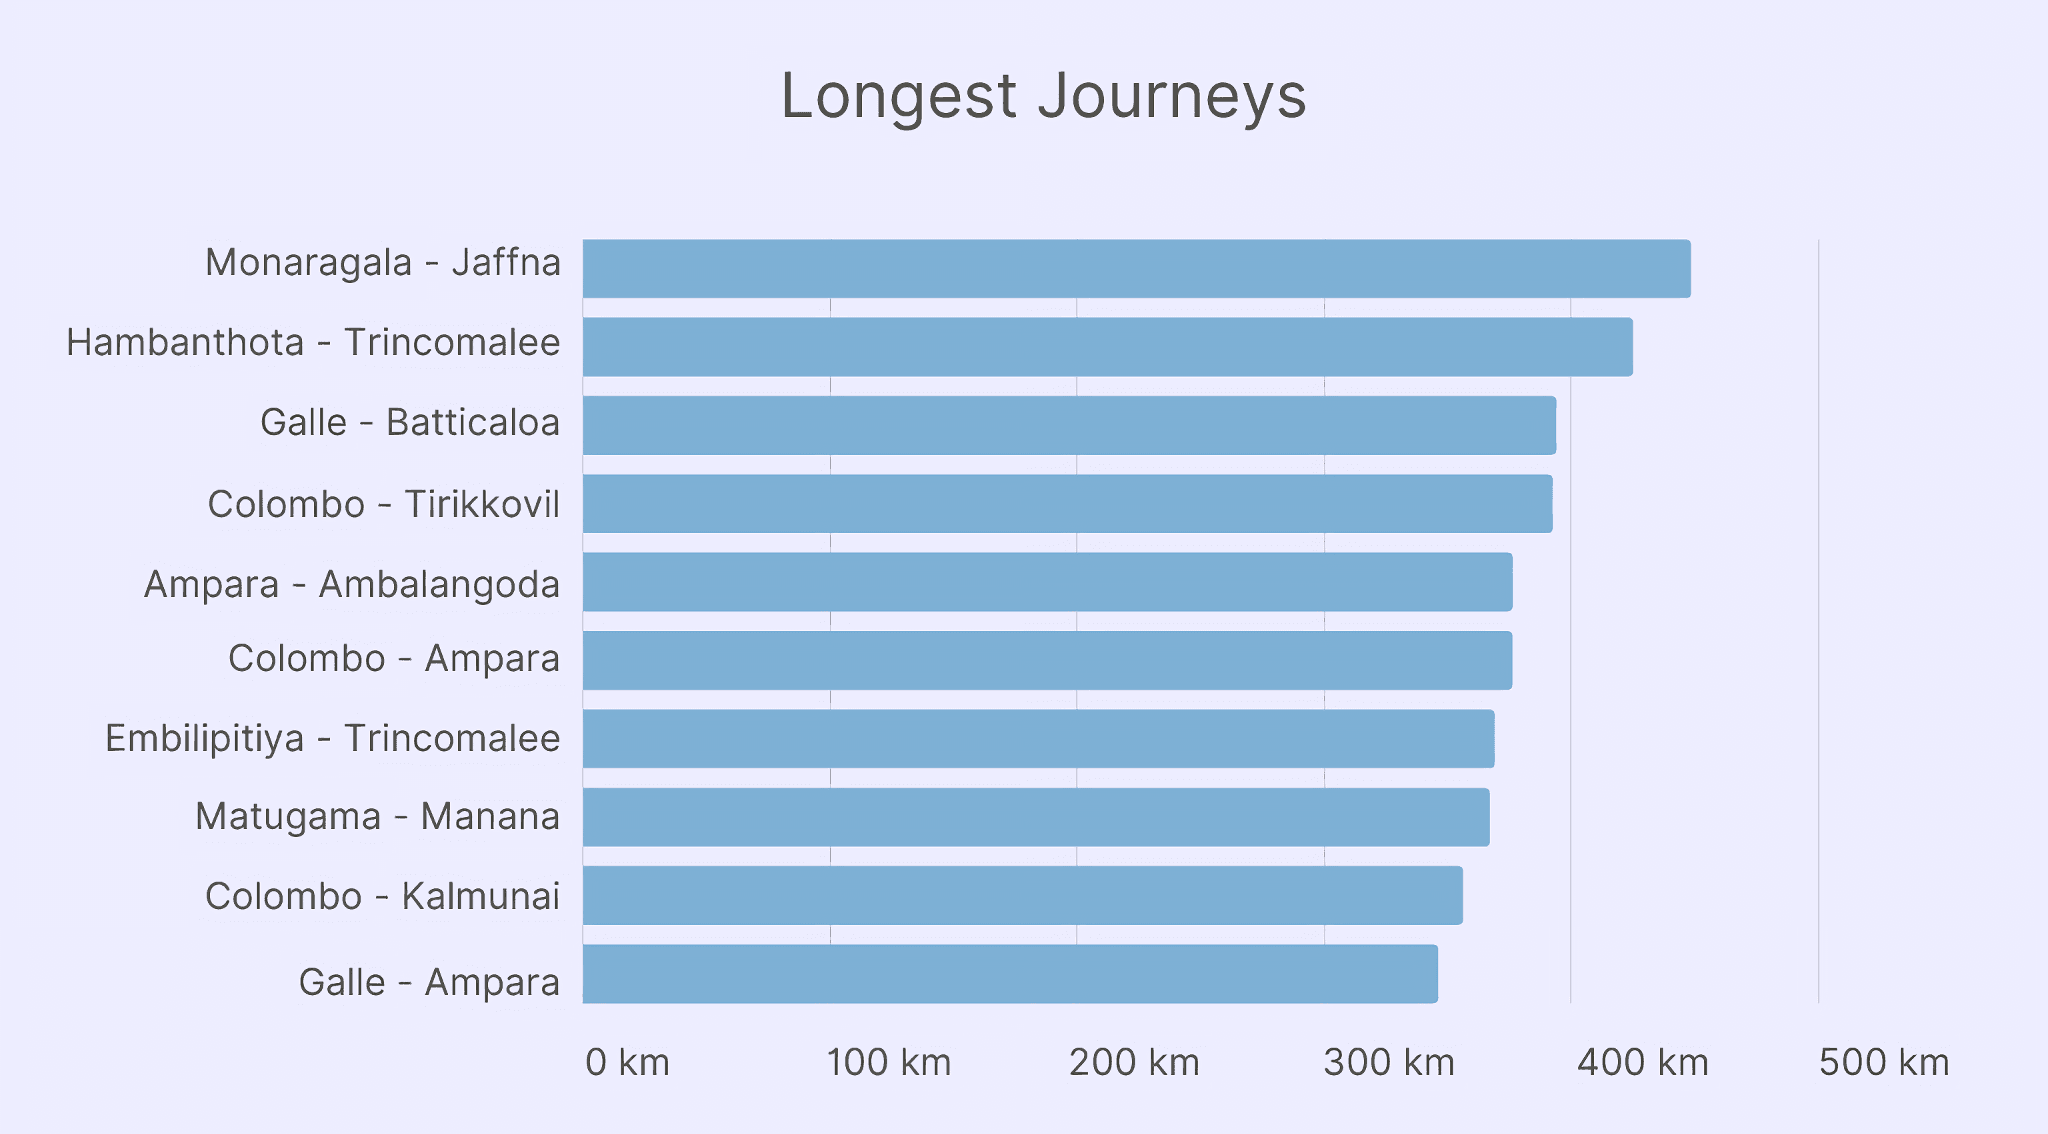
10 Longest Journeys
On the other end of the spectrum, the least number of trips correlate with the longest journeys. The longest journey between Monaragala and the northern district, Jaffna is almost 450km with a travel time of 13 hours.
Most of these longer journeys frequent to 1 or 2 per day, except for Colombo and Ampara route — which spans the entire lateral width of the island 12 times a day. These routes also tend to avoid the mountainous terrain of central province and navigate around instead.
Use the mapping tool below to analyse route-by-route details for these 10 longest trips.
Distribution of Origins and Destinations
Most routes originate from major hubs in their respective districts, but branch out into an extensive network of destinations. The reds on the heatmap the indicate a higher condensation of start or end points of a trip. The greens and blues indicate less condensation respectively.
Closing Notes
I hope these visualisations help generate more meaningful insights.
If you are curious — all routes "Normal bus" routes are visualised here at this tool (Caution: ~15mb data download if you are on metered connection)
Routes were generated via OSRM (opens in a new tab) so there might be deviations from the actual route. Mahiyangana - Ransalatenna routes was omitted from this visualisations because "Ransalatenna" could not be located. If anyone happens to know, please enlighten me at mail@heyitsnuwan.com
Further Reading
- Too Slow Too Furious (opens in a new tab) - A Comprehensive analysis on Sri Lanka's transportation system
Acknowledgments
- Dataset available here (opens in a new tab). Special thanks to team-watchdog (opens in a new tab) for cleaning and making the data publicly available
- Leaflet.js (opens in a new tab)
- Leaflet-heat (opens in a new tab)
- Openstreetmap (opens in a new tab)
- Stadiamaps (opens in a new tab)
- OSRM (opens in a new tab)
The official routes for these buses are not published online, therefore the origins and destinations from the dataset were mapped to their approximate geocodes using Google Maps API.
Routes were generated with the help OSRM which provides turn-by-turn routing information. These routes were then converted into GeoJSON compatible geometries that can be visualised on the maps.